This website uses cookies to improve your experience. We'll assume you're ok with this. Know more.

Visualize Microsoft 365 Usage and Adoption Data

No more struggling to visualize data with PowerBI and Excel. AdminDroid provides all-inclusive details about Microsoft 365 Usage & Adoption to improve efficient resource usage and manage investments in the organization.

Visualize Usage and Adoption Data without Excel
Analyze usage of Office 365 resources with enriched dashboard
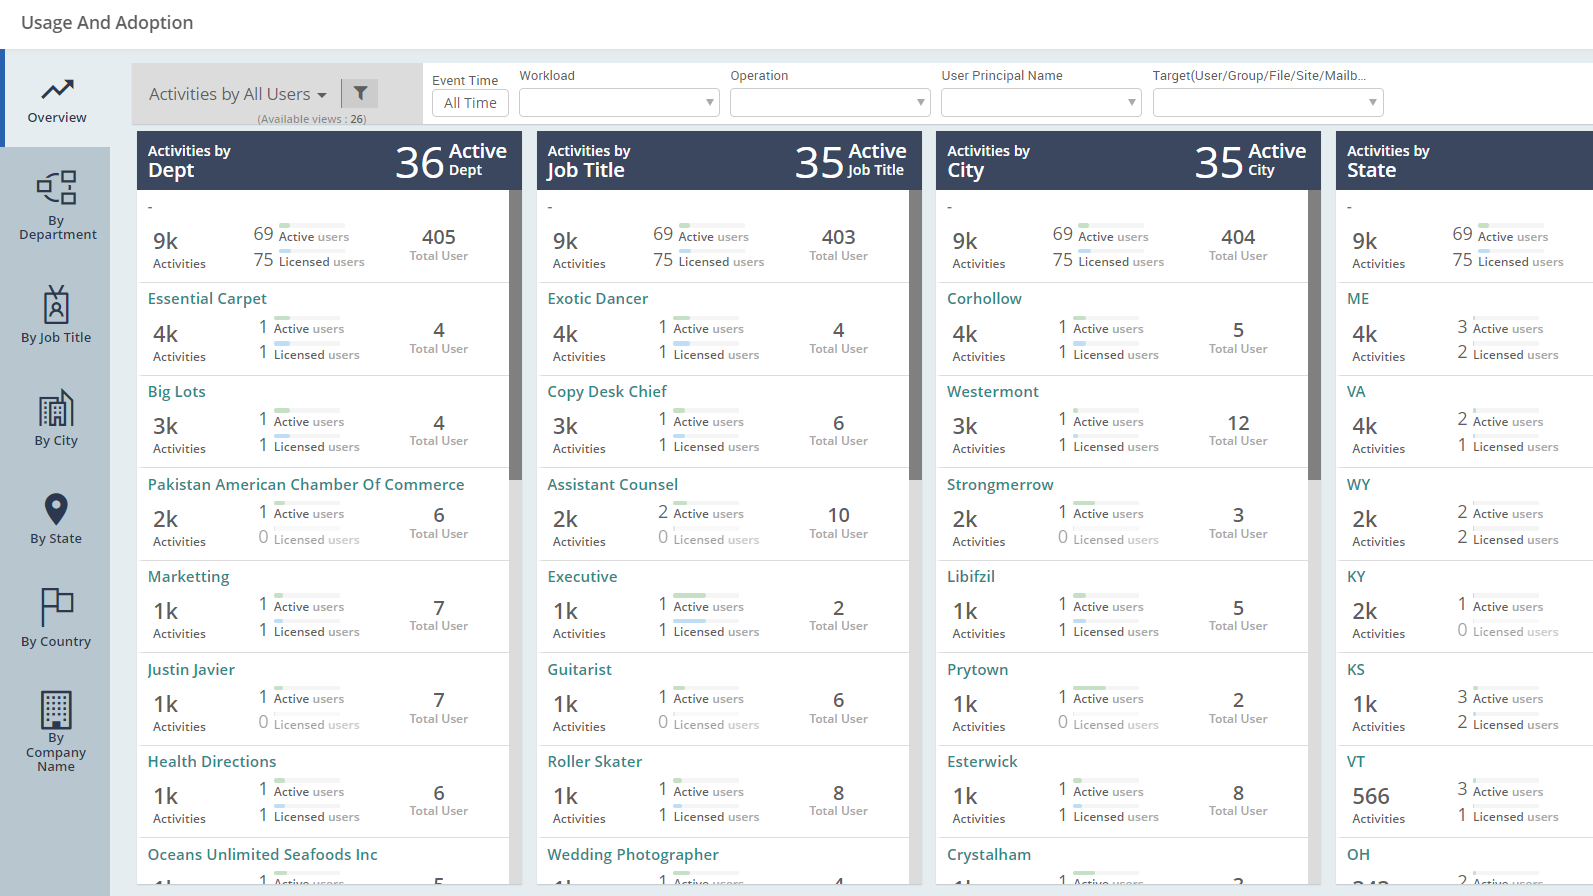
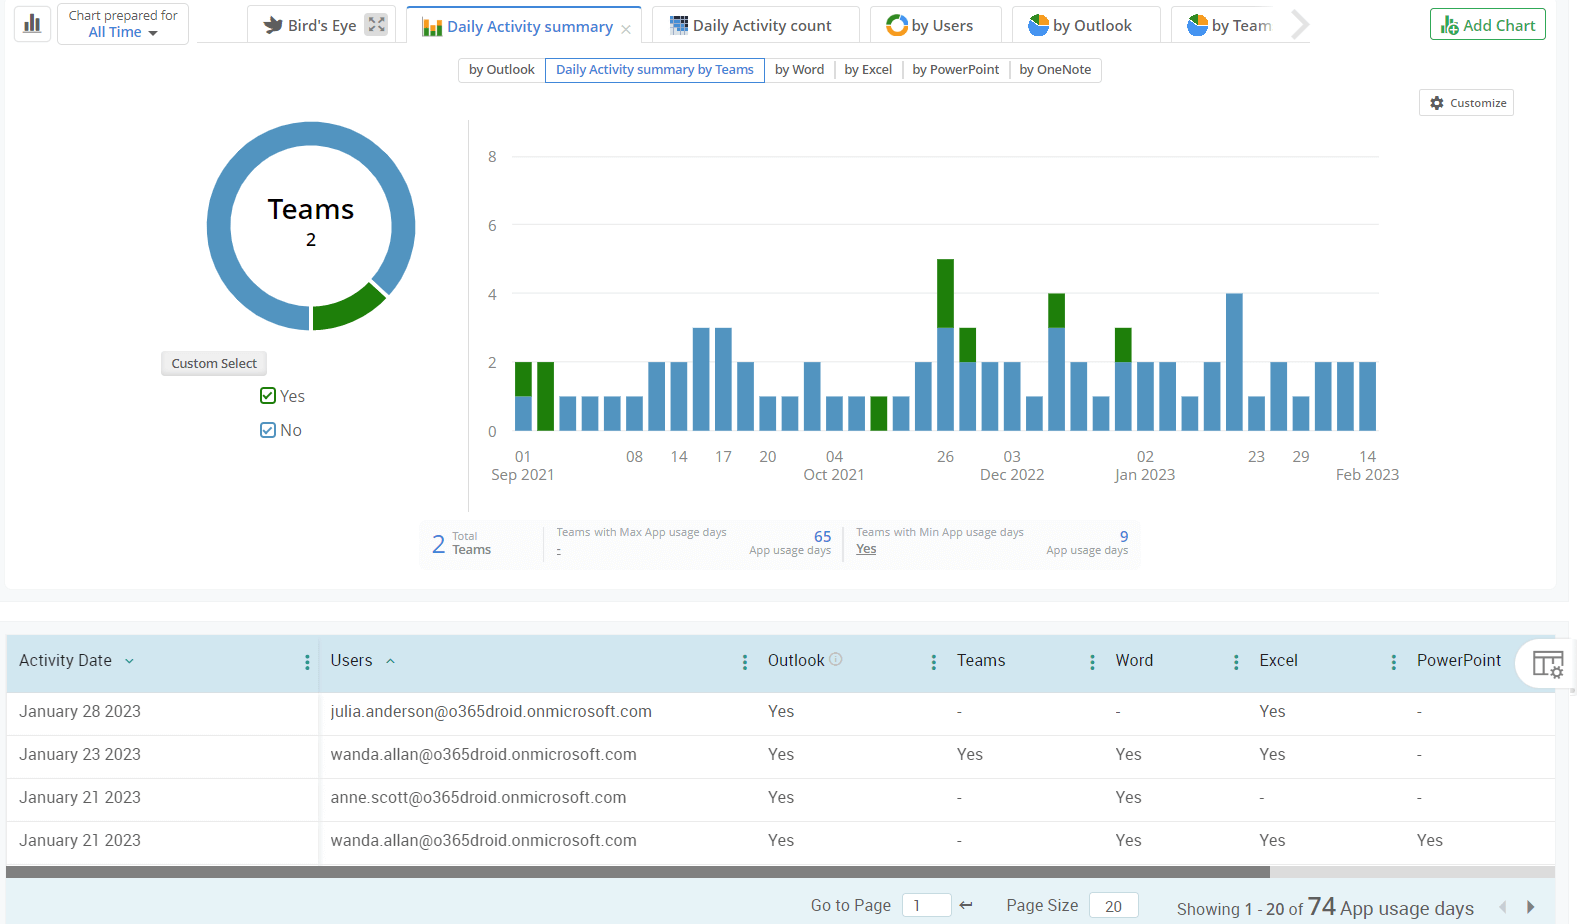
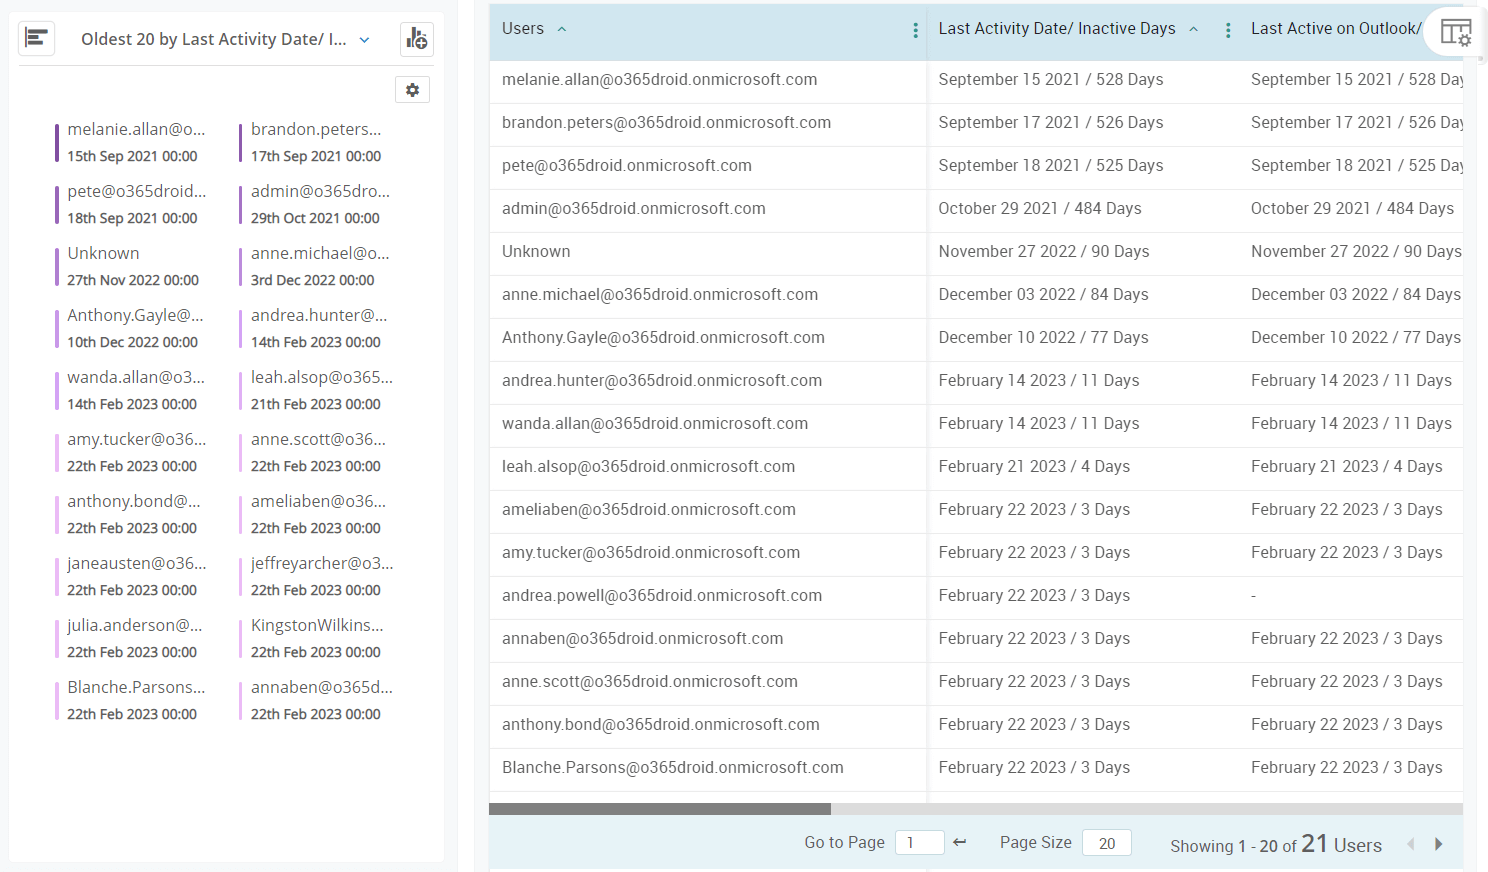
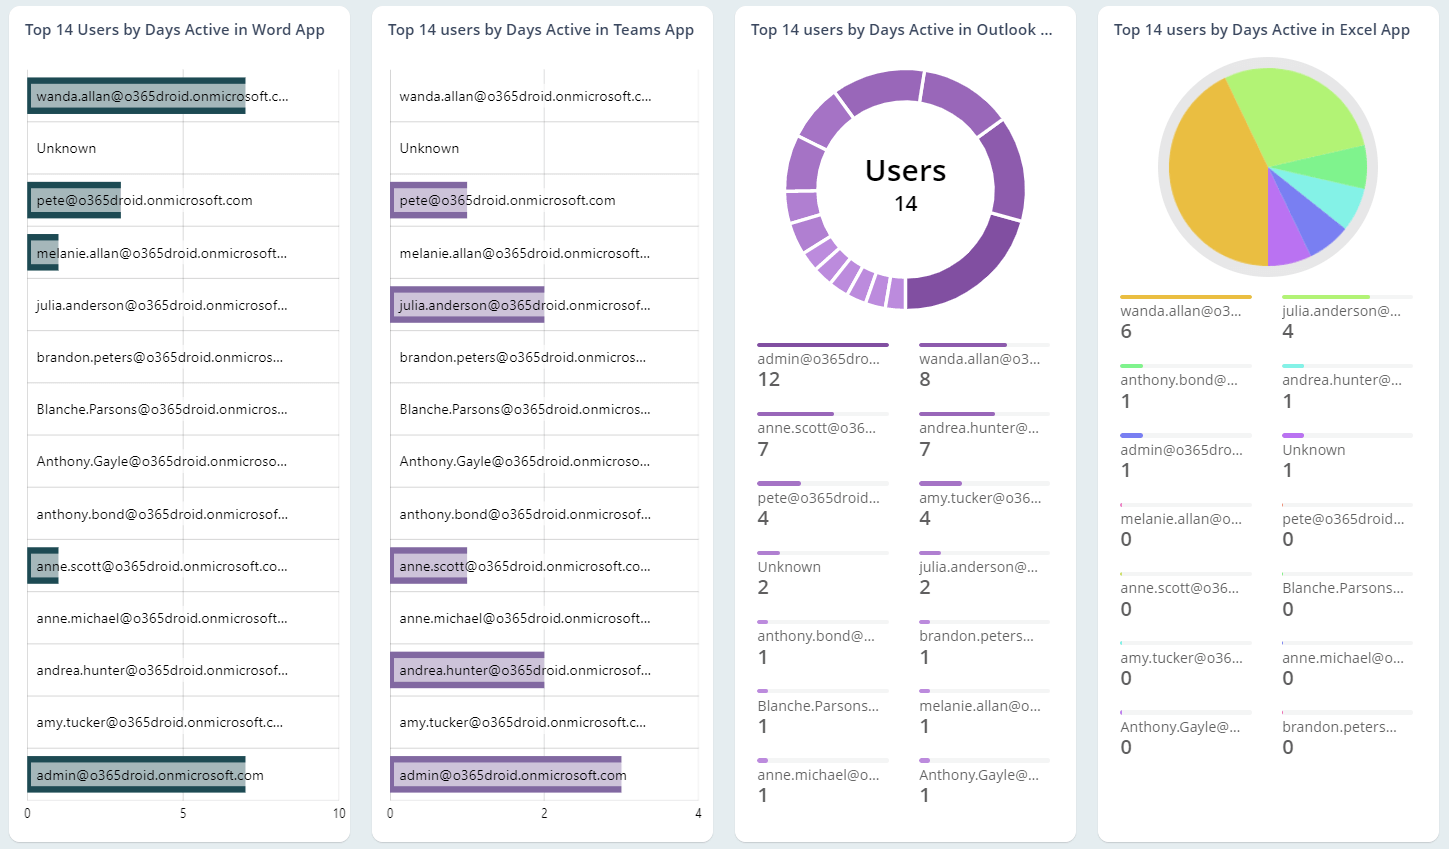
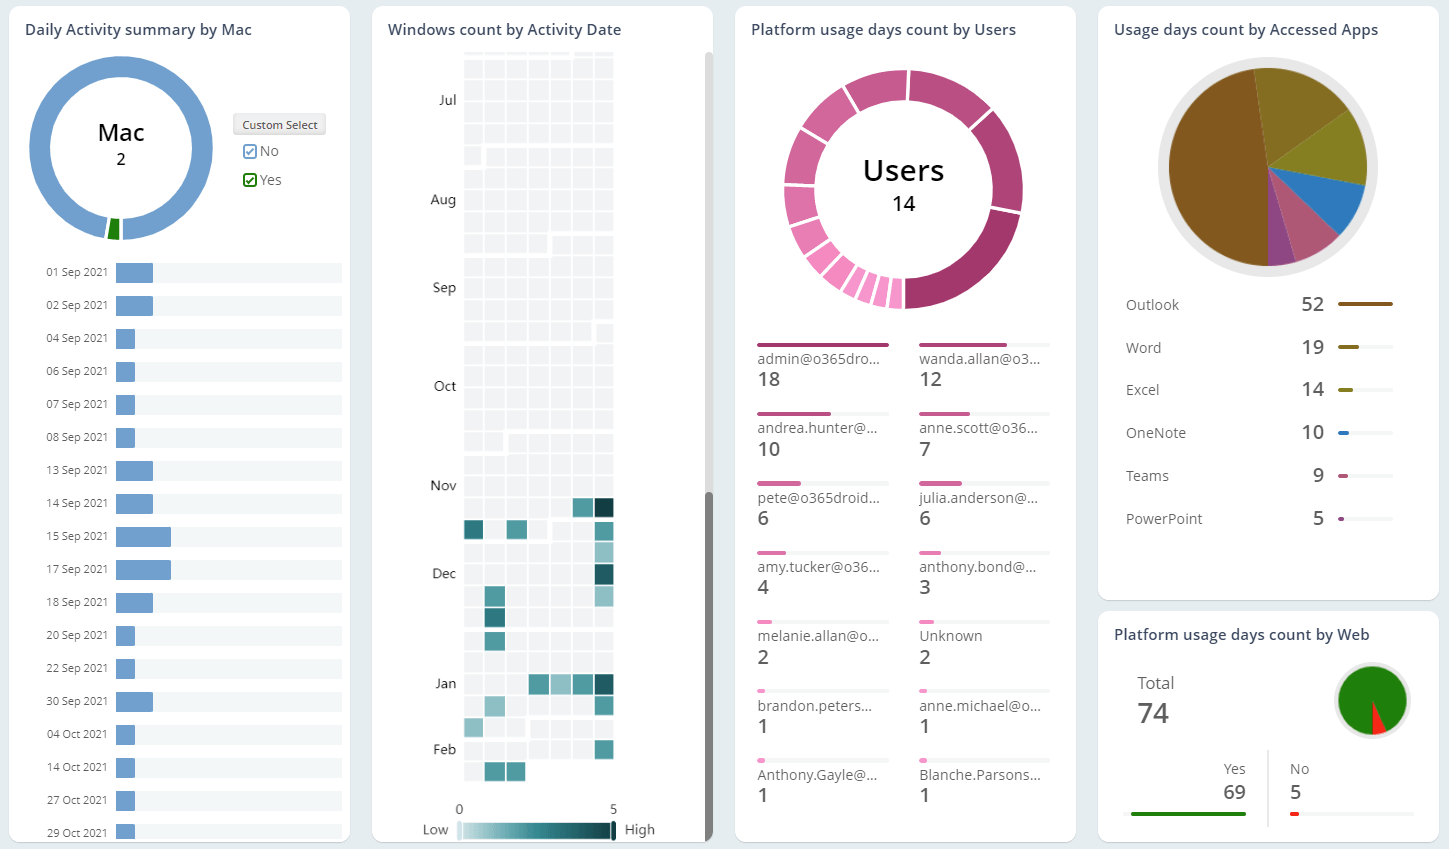
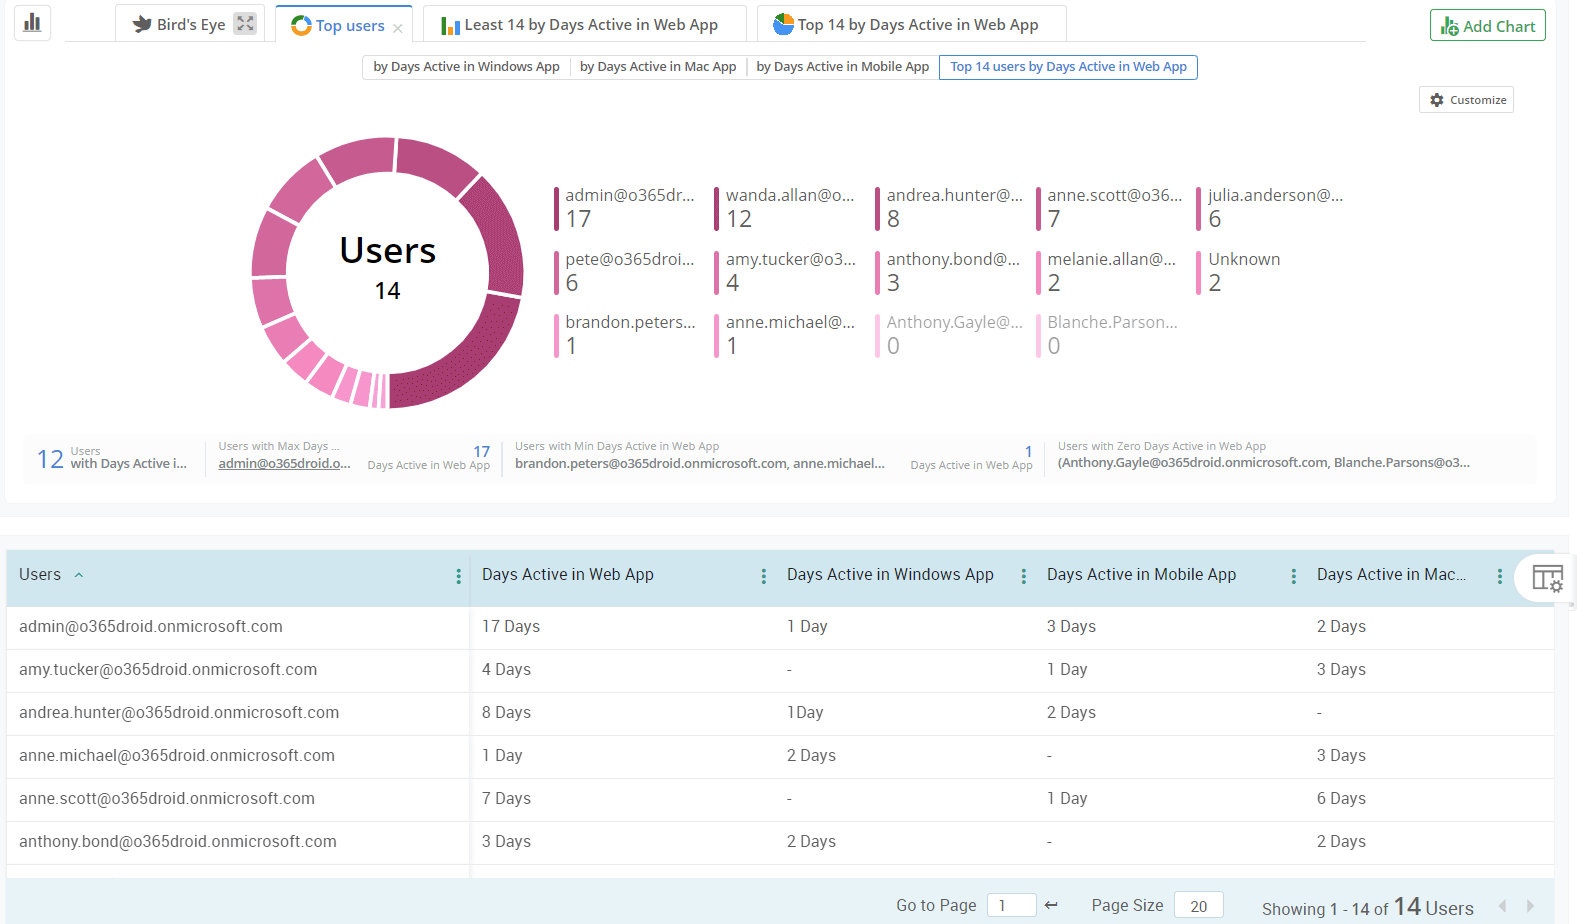
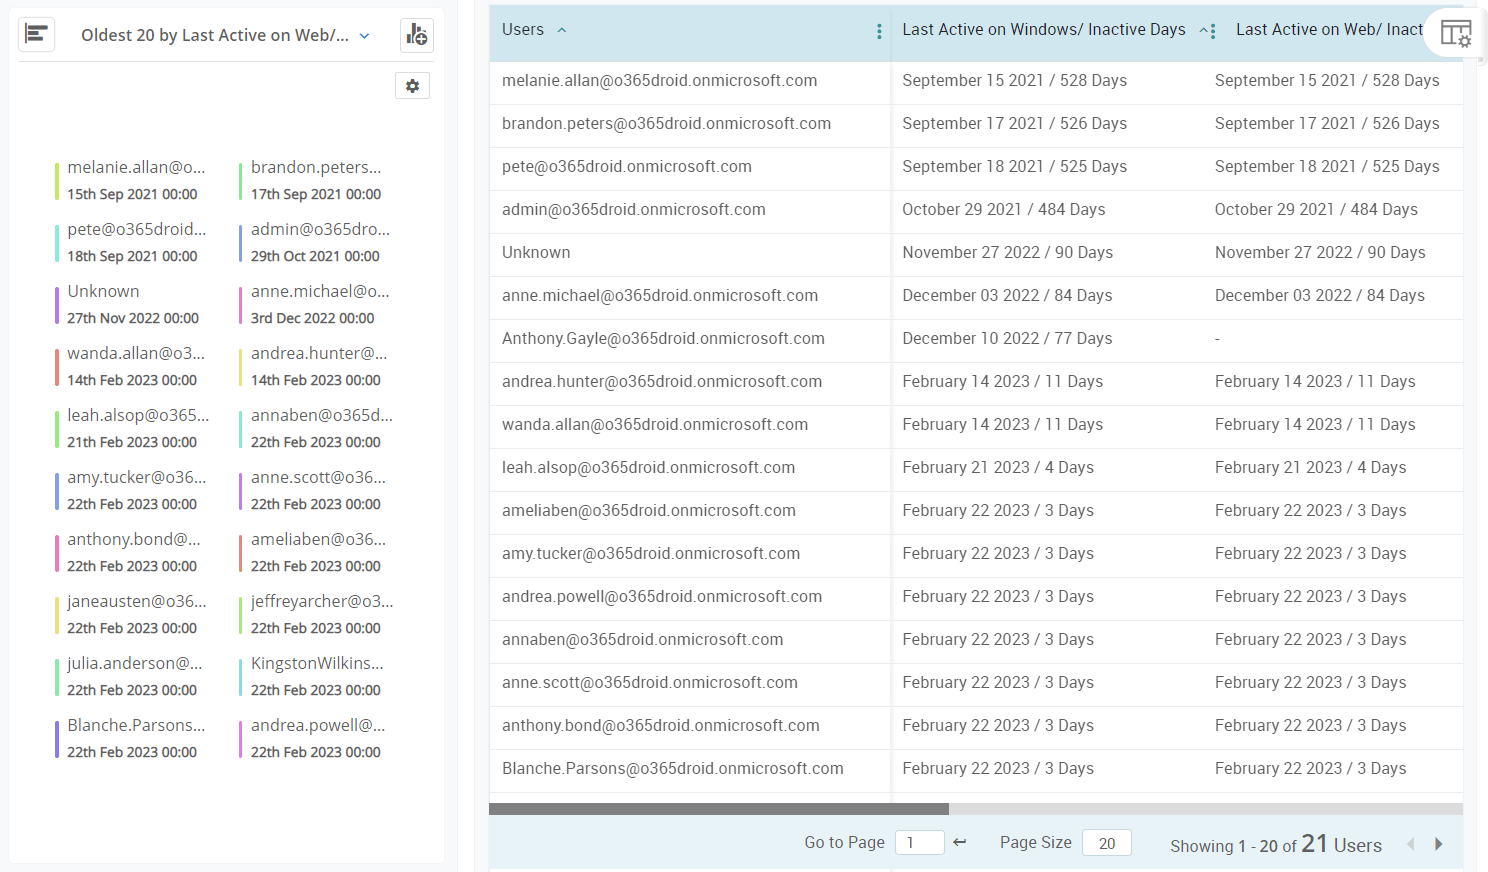
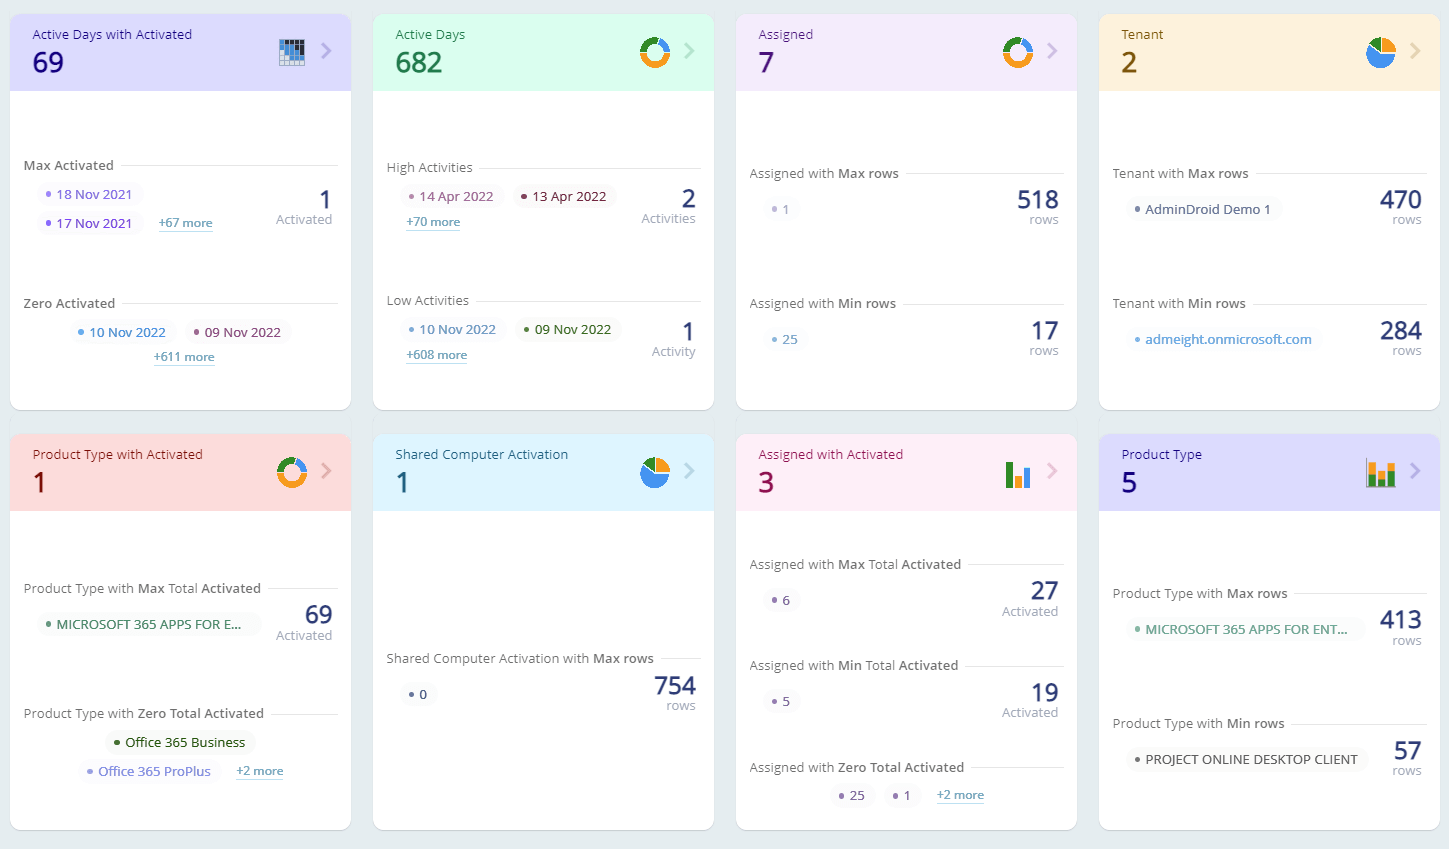
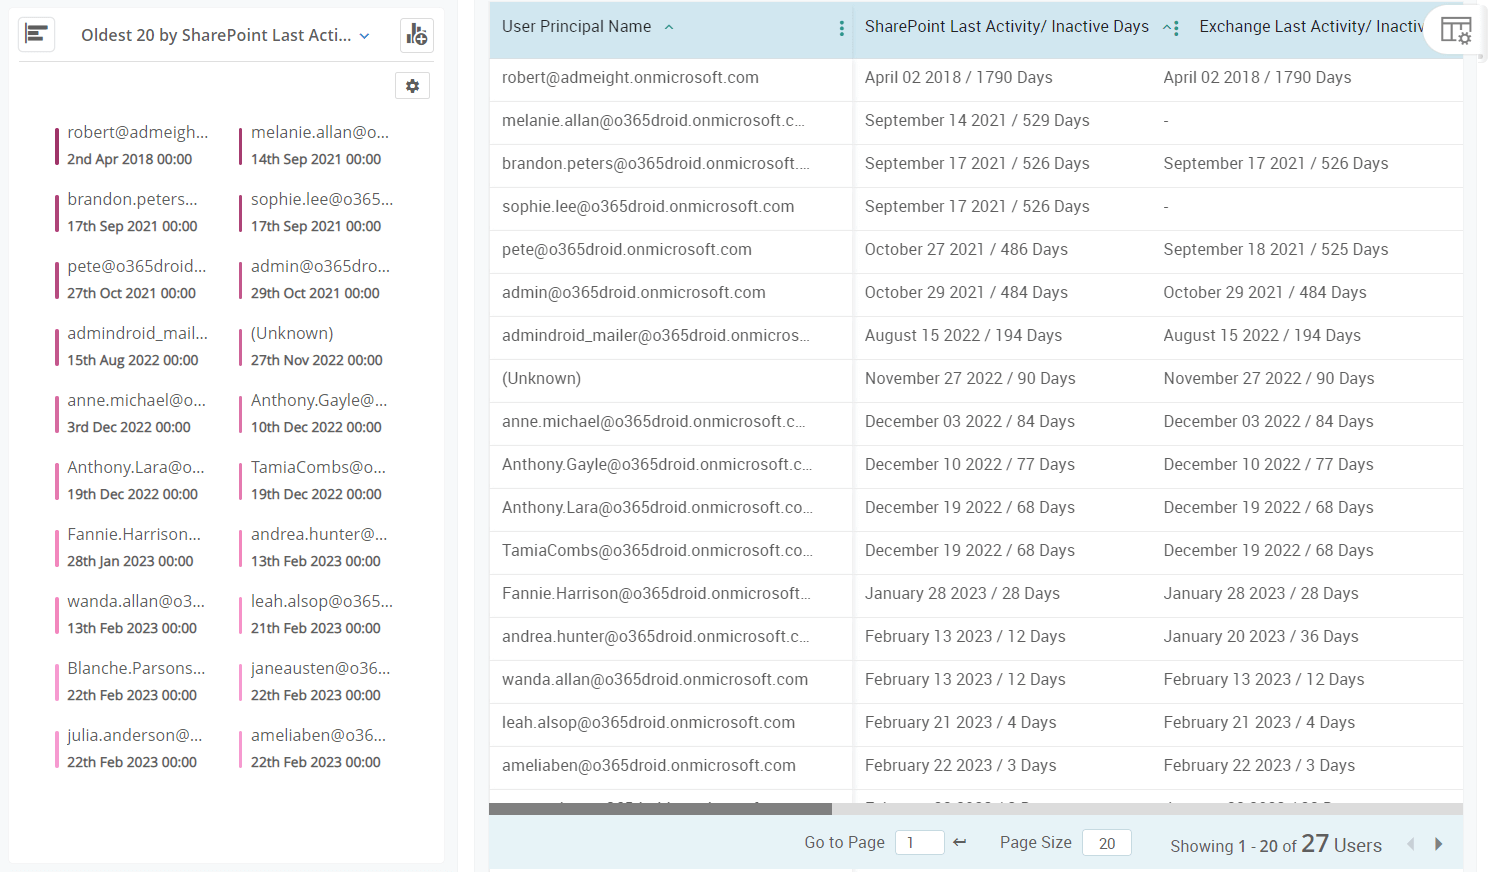
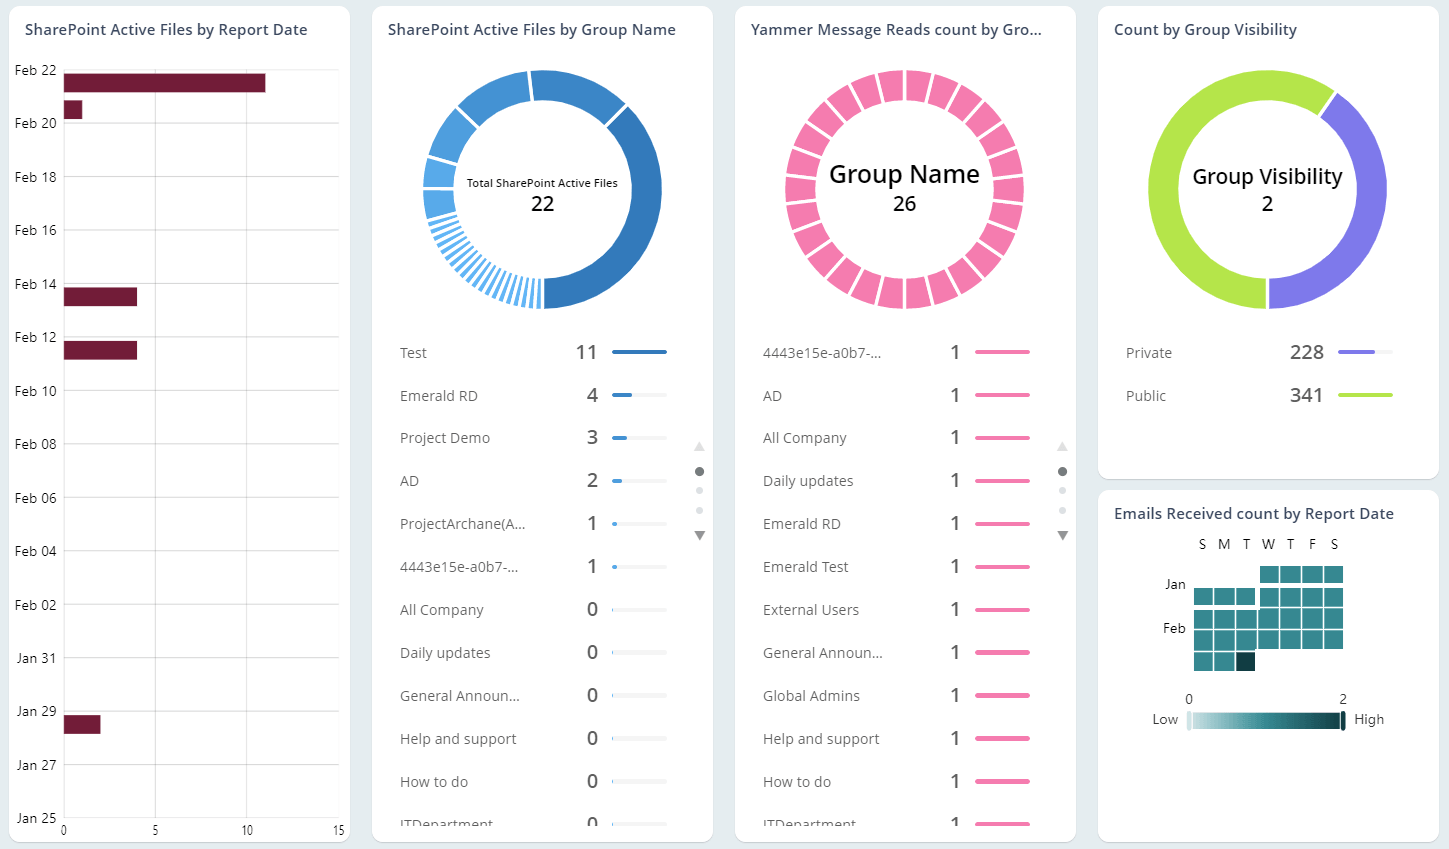
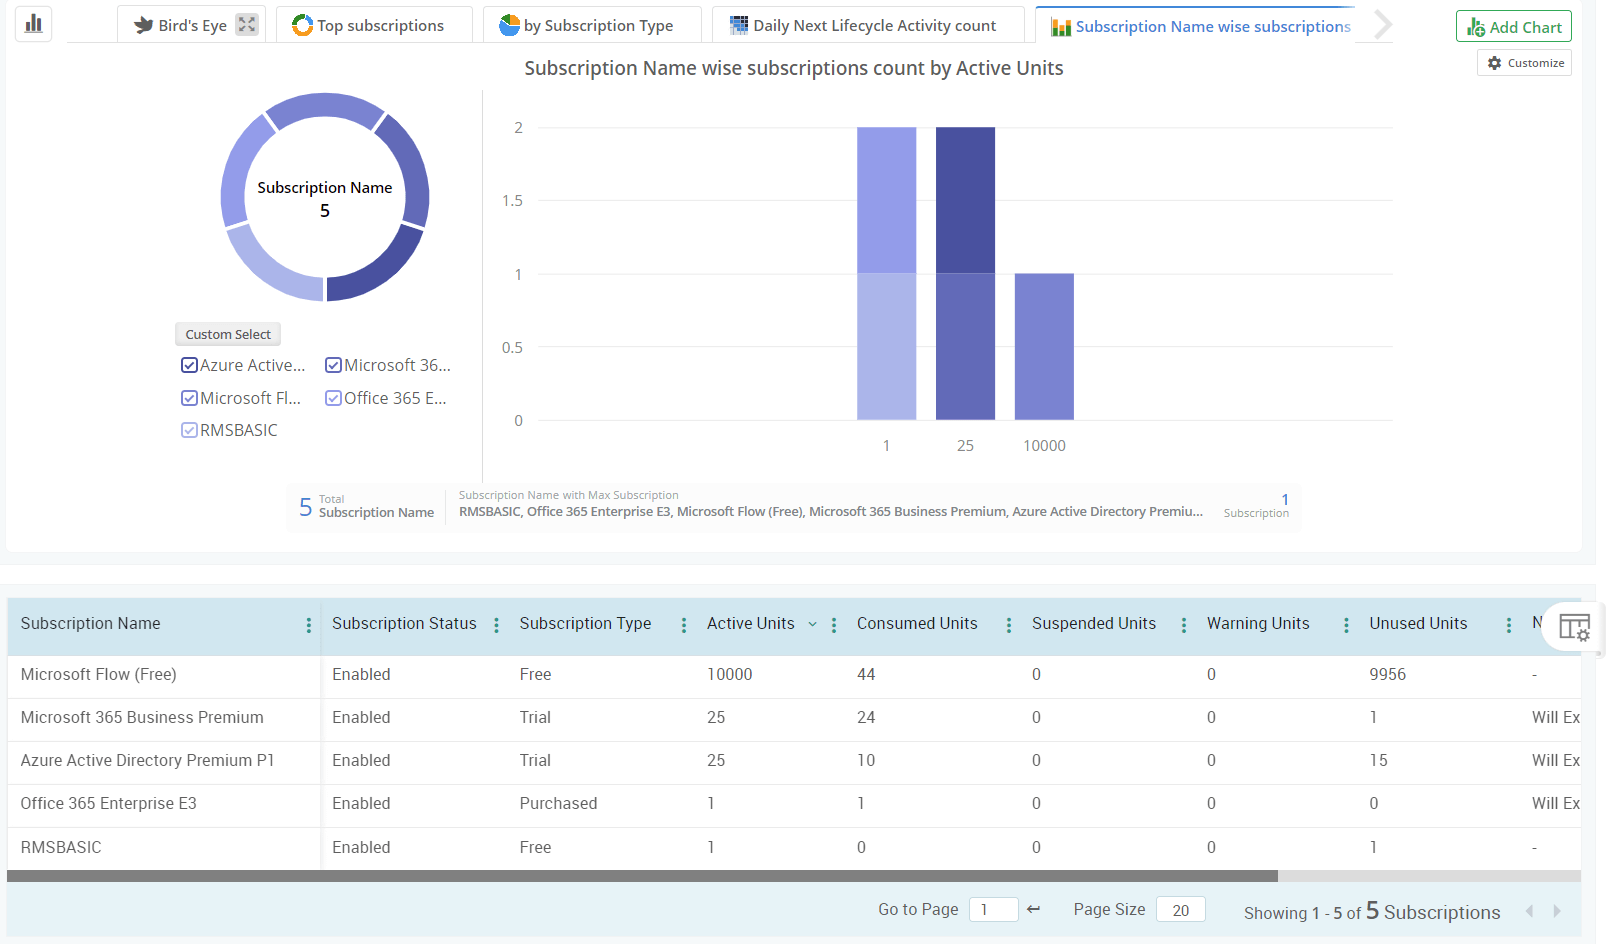
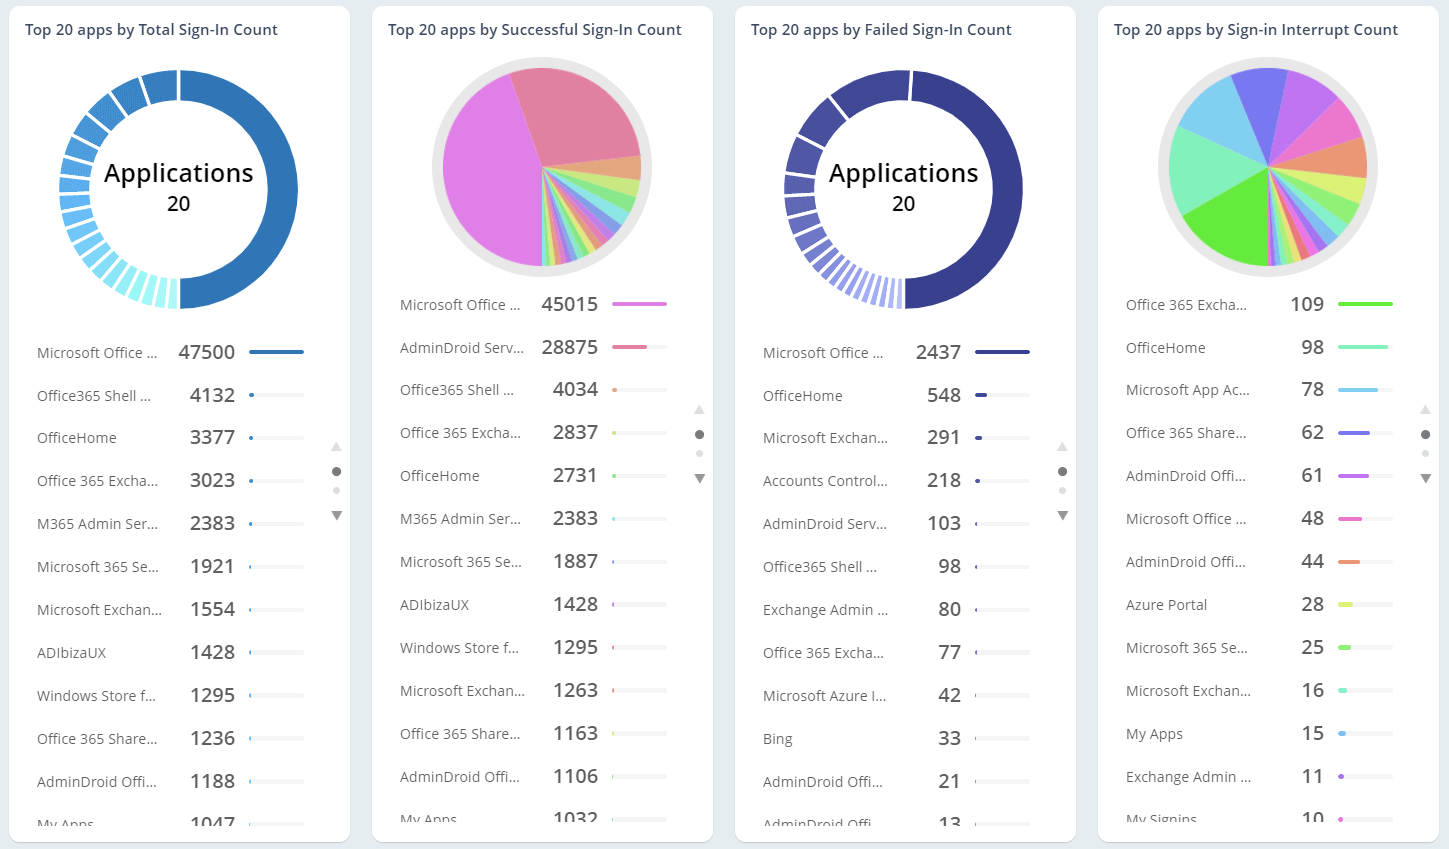
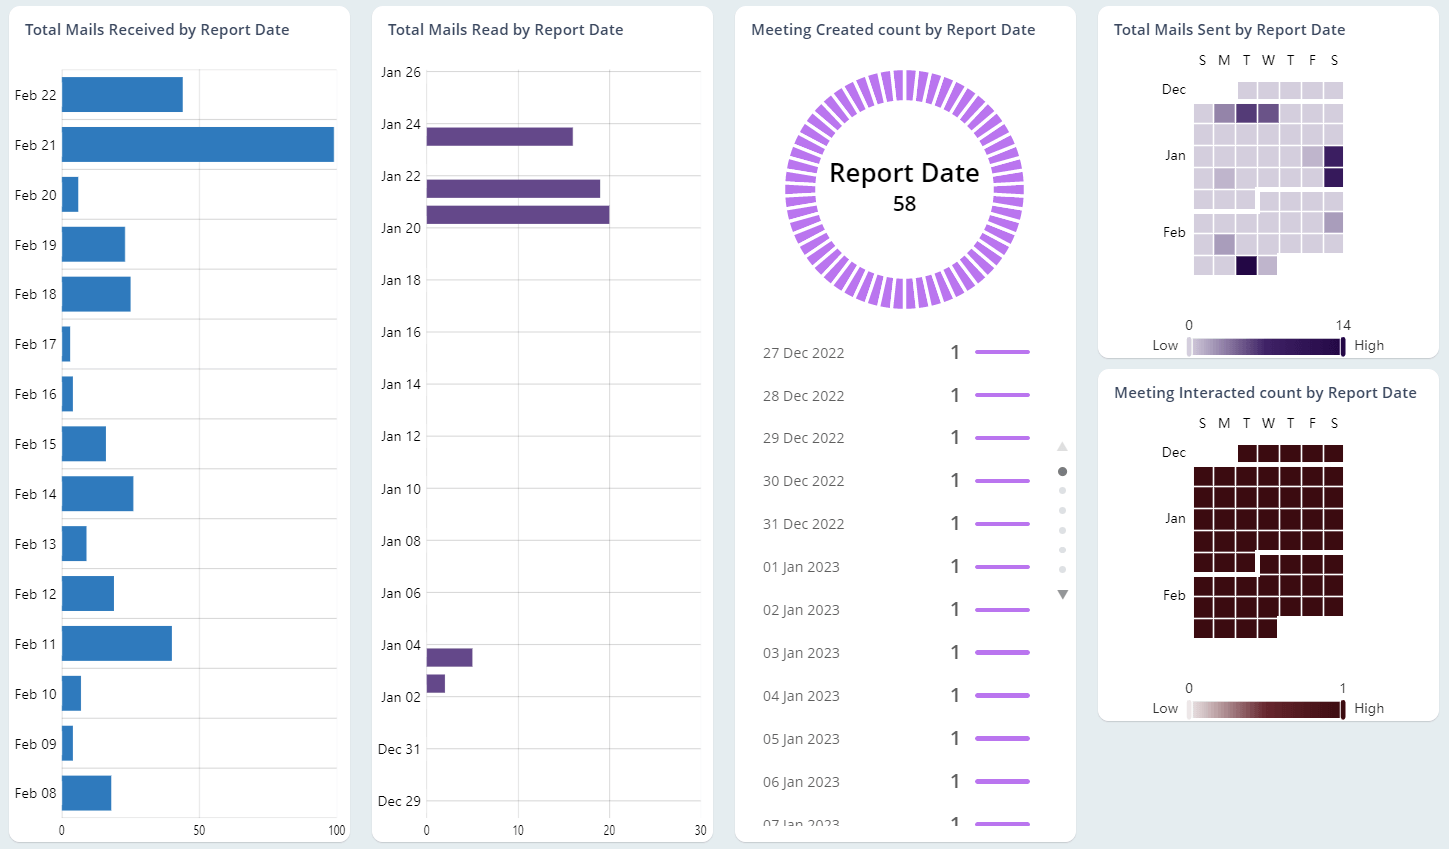
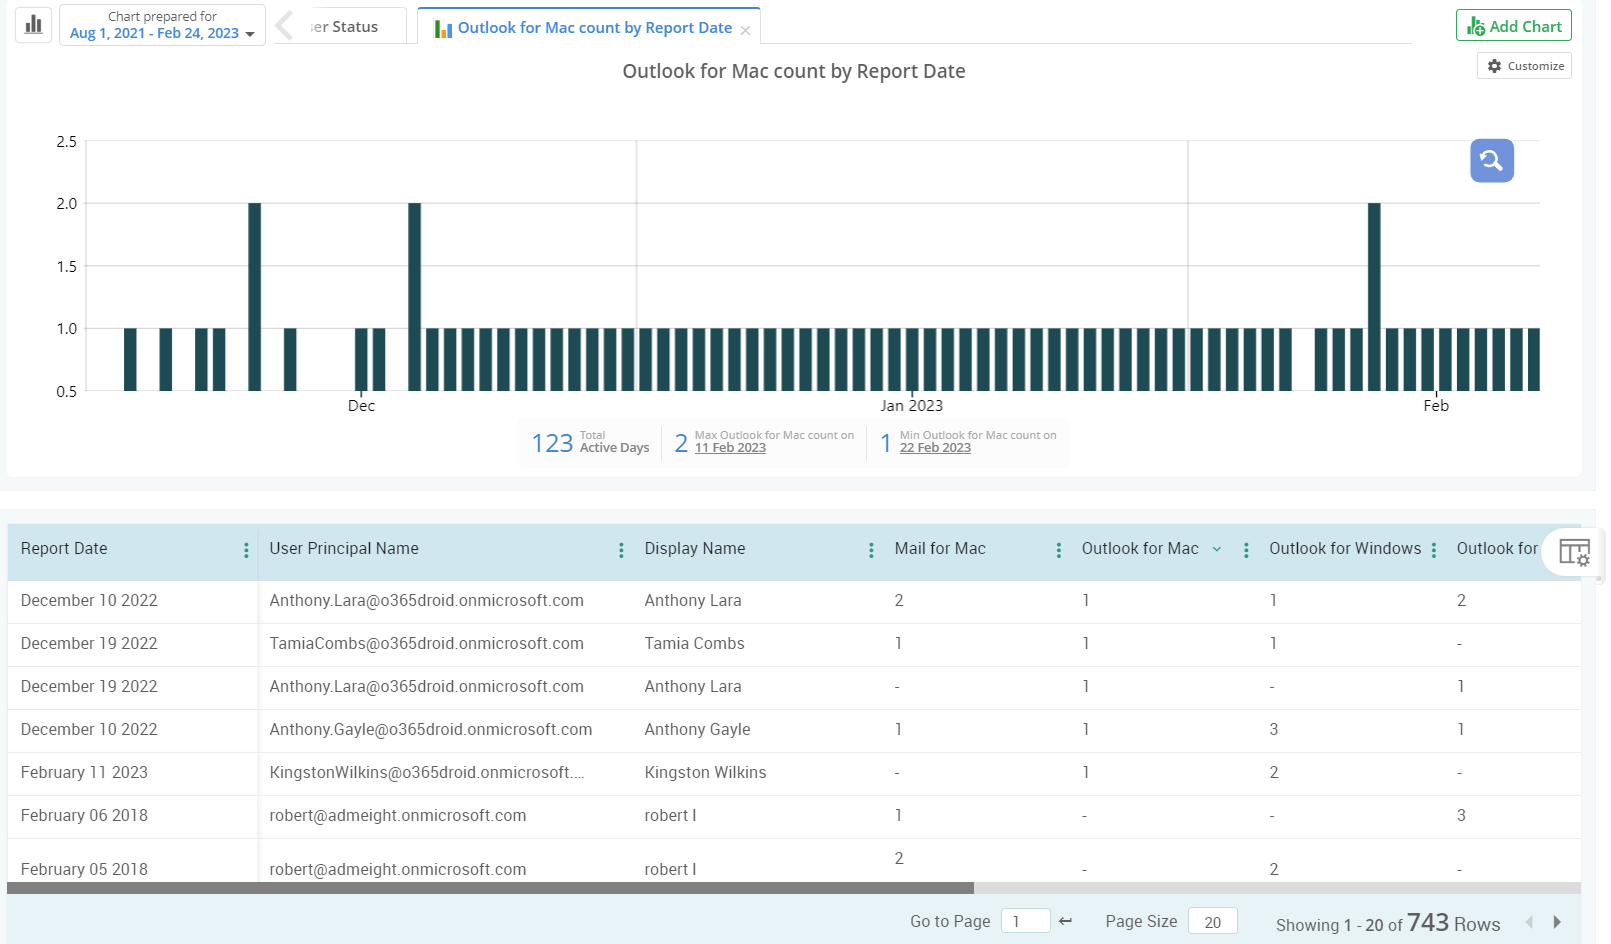
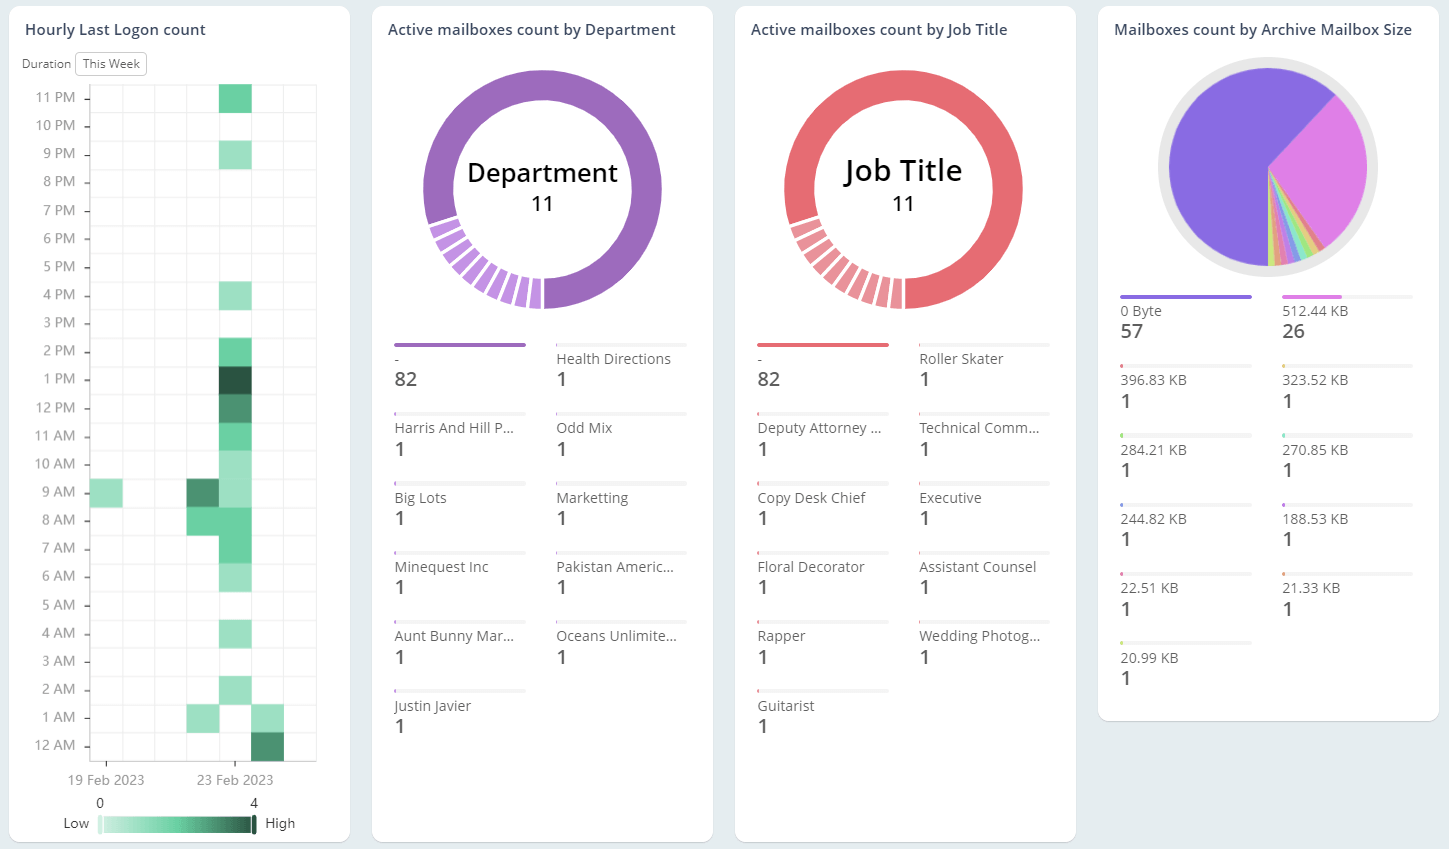
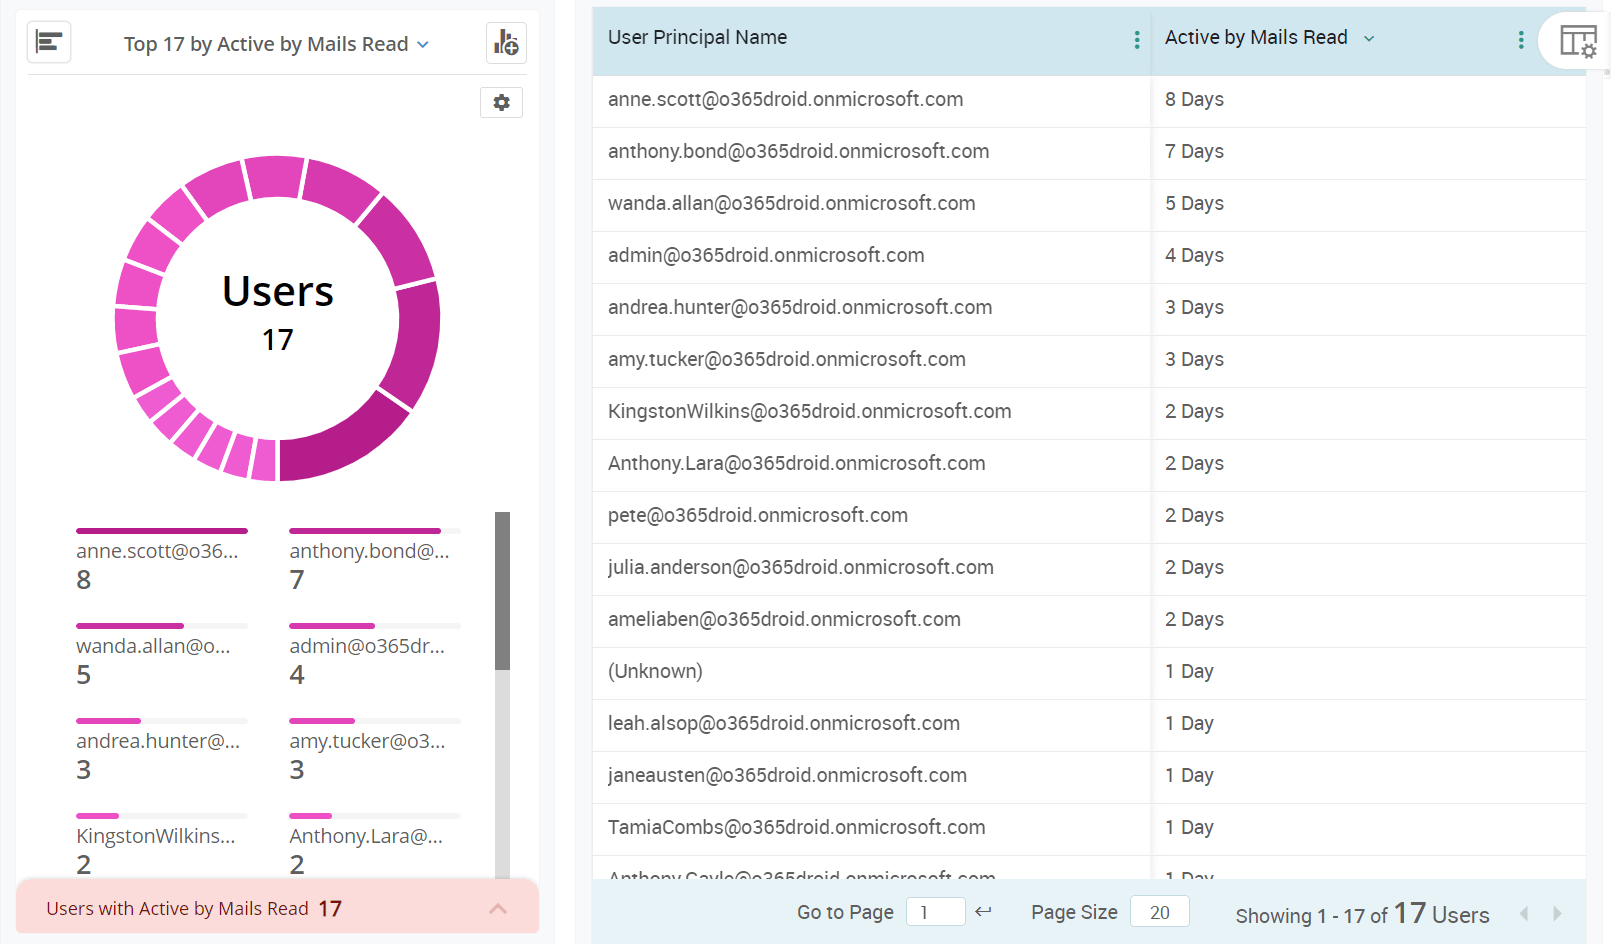
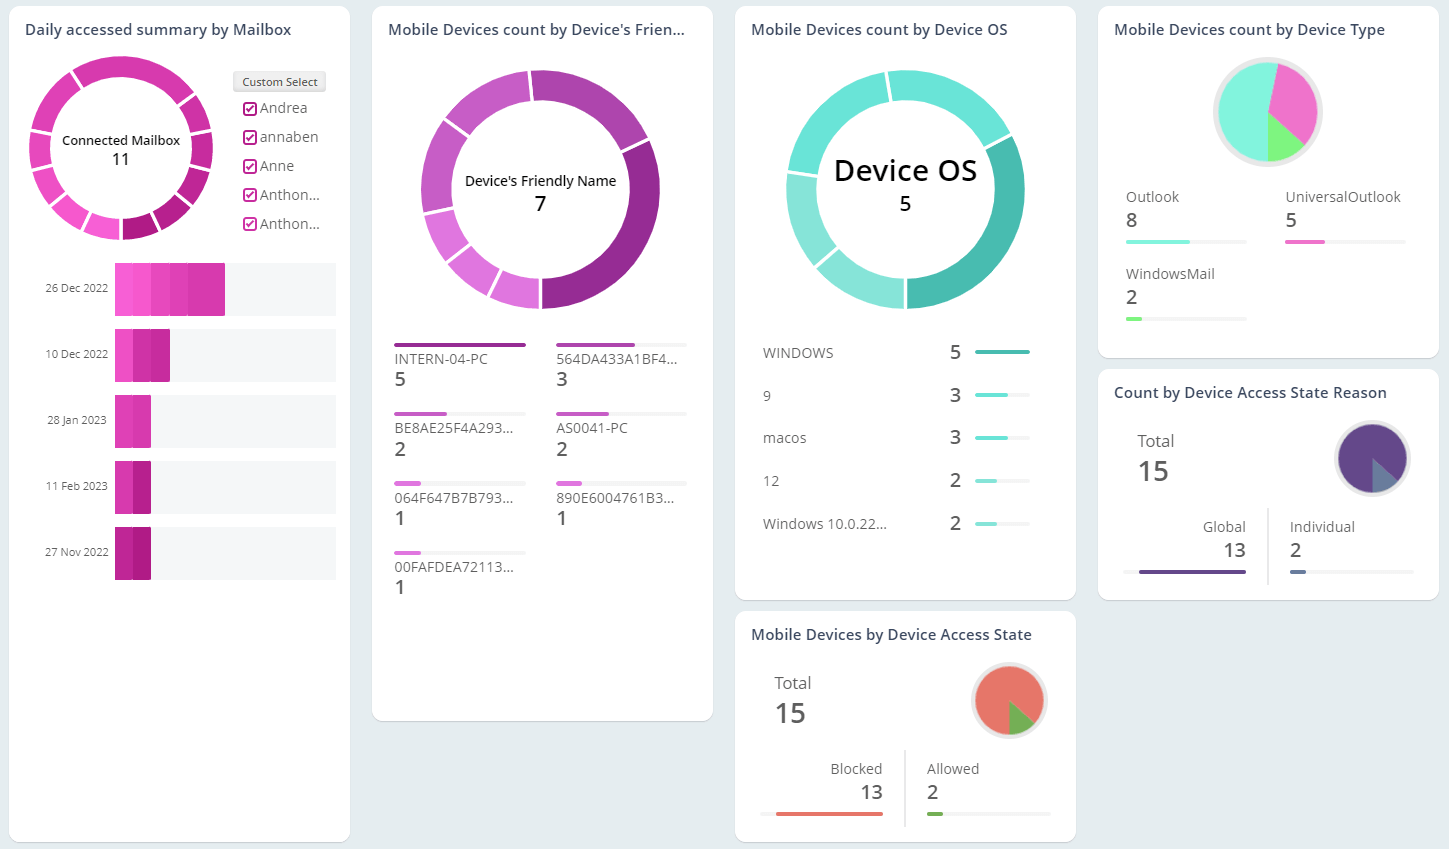
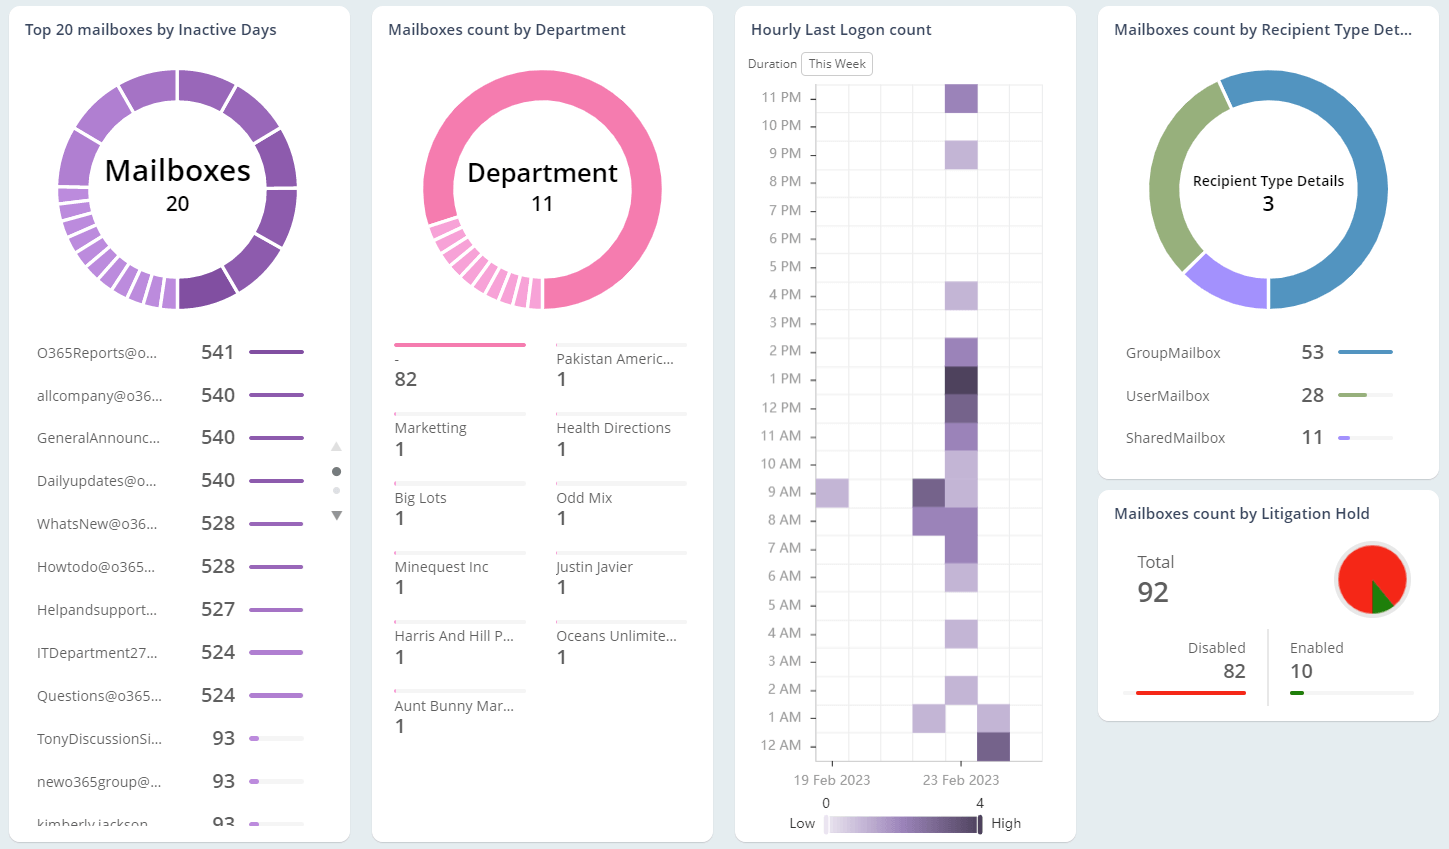
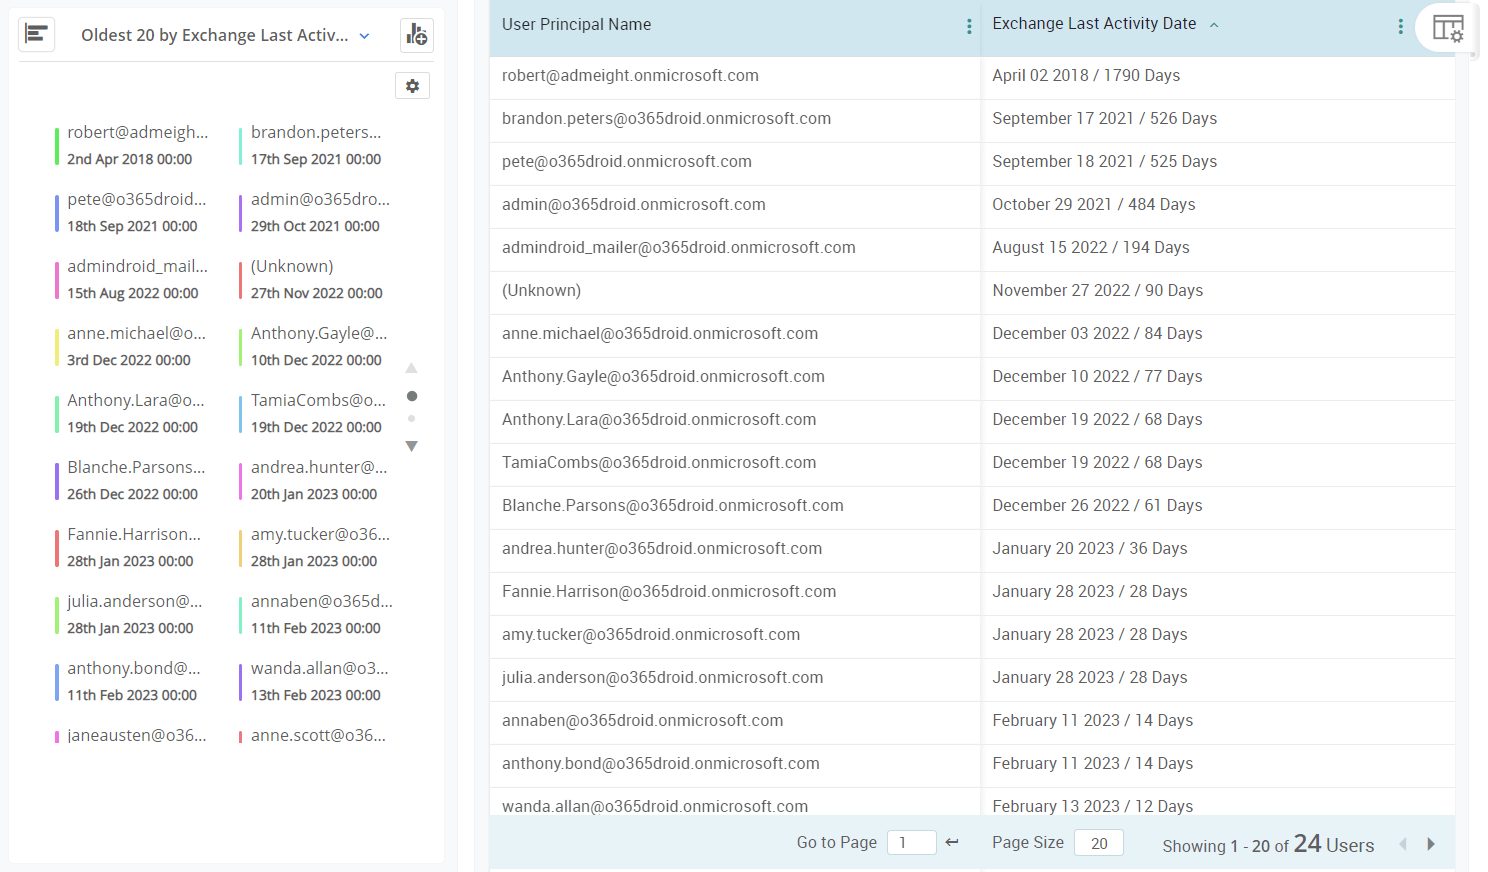
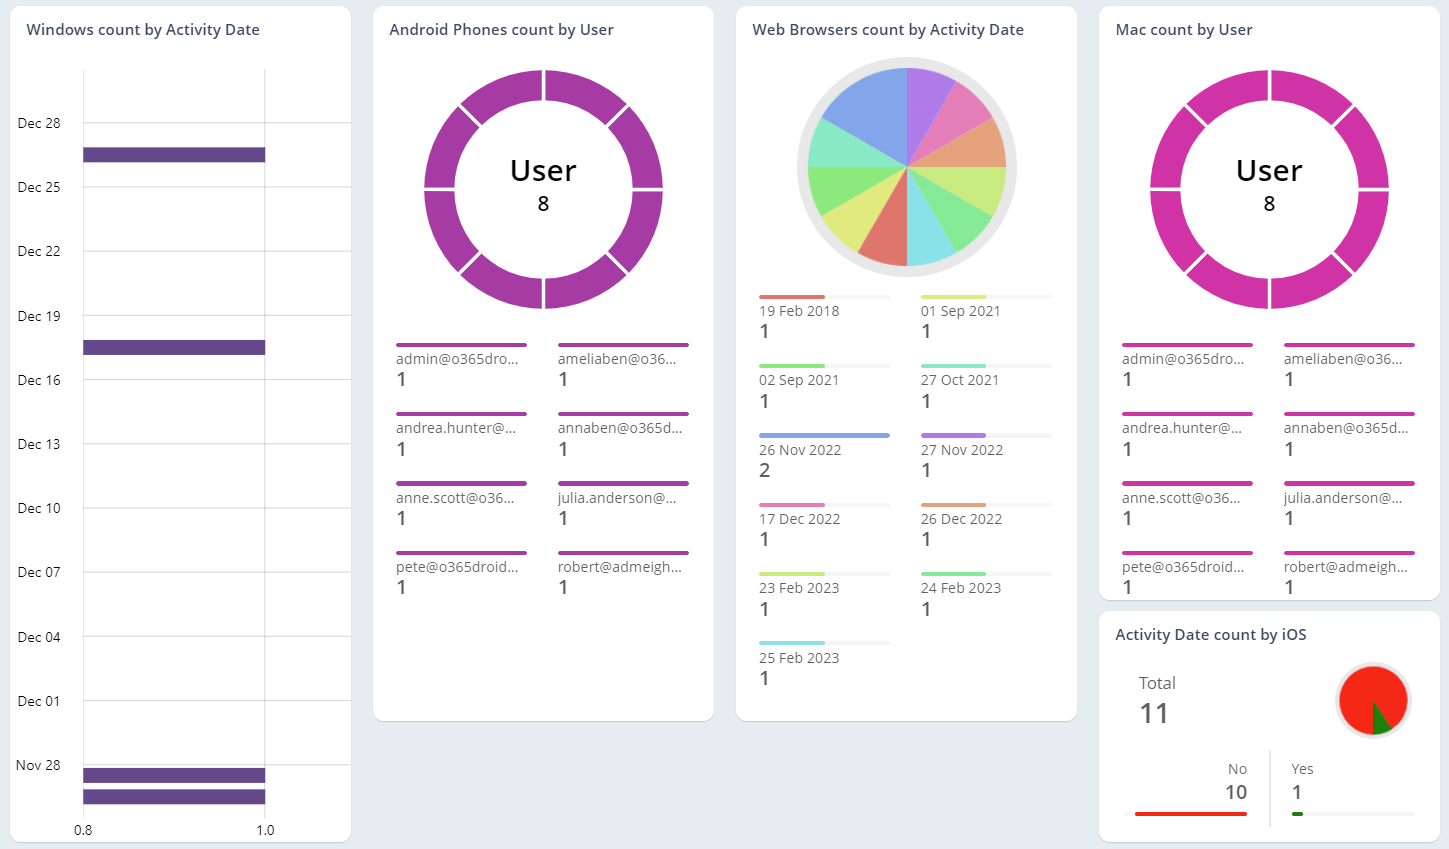
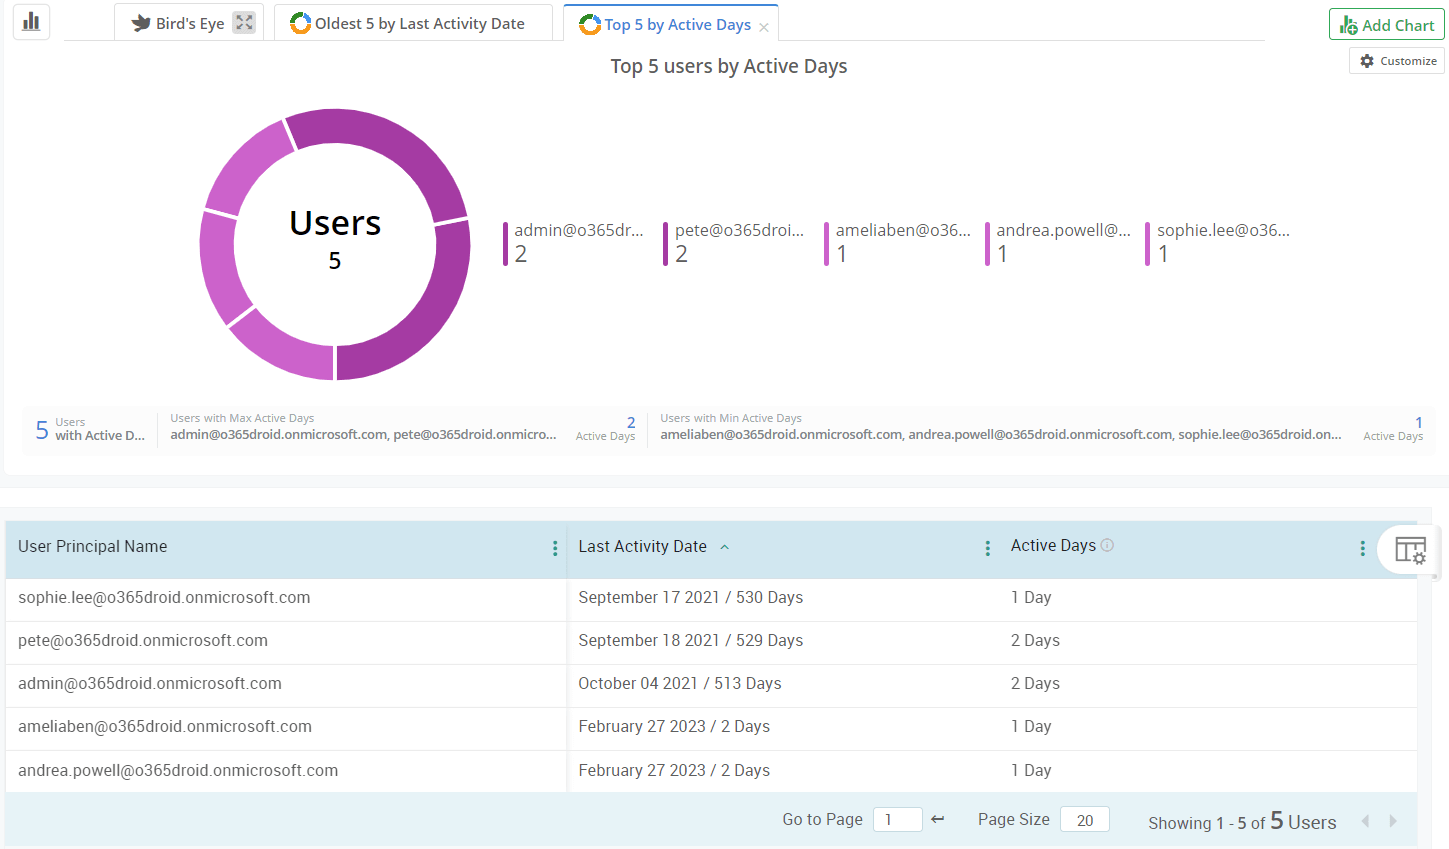
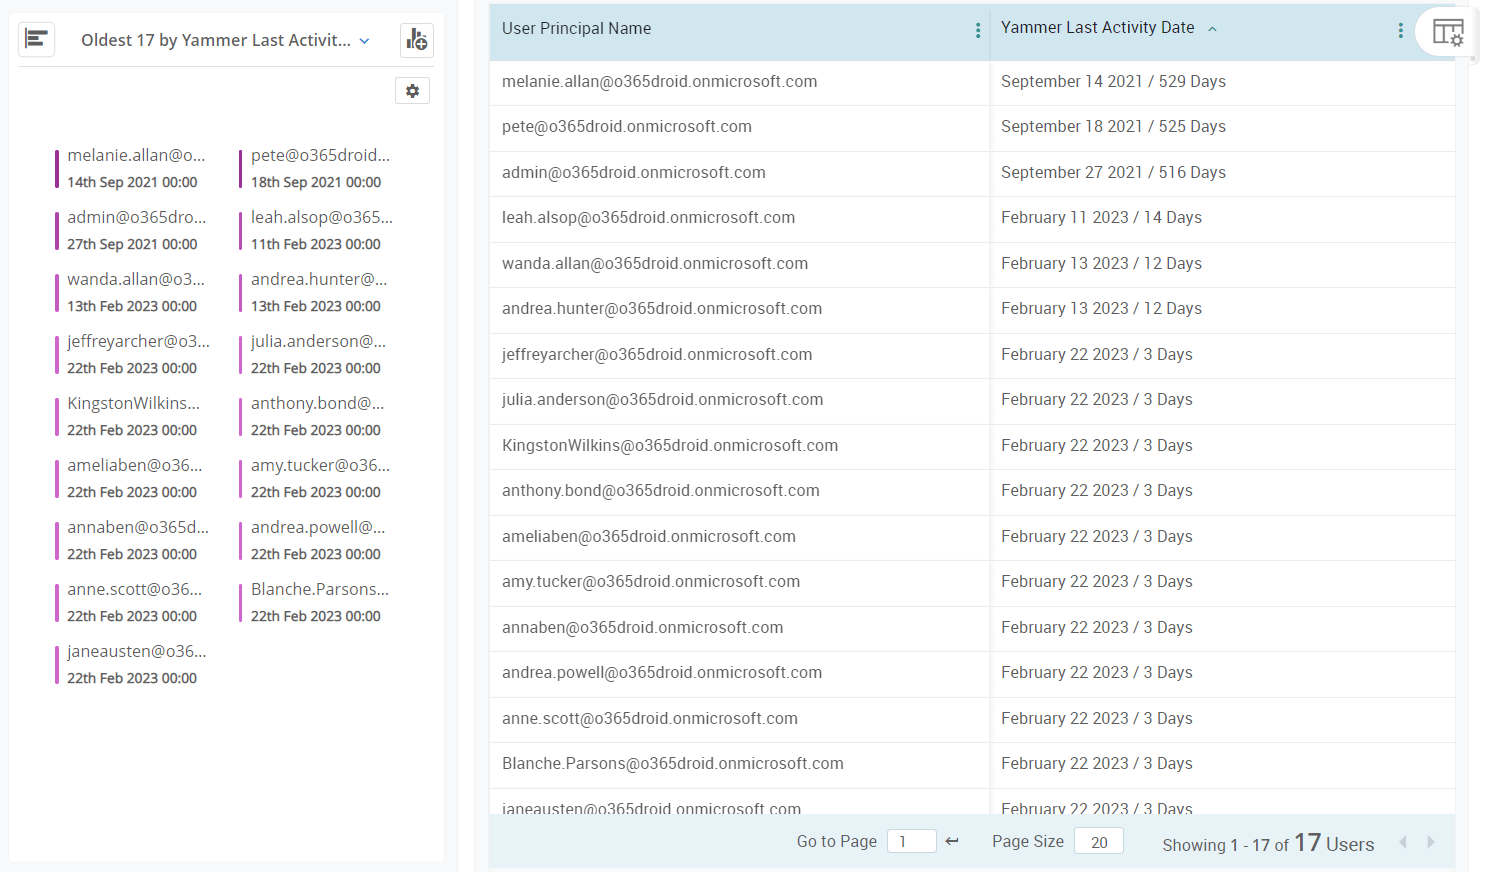
Analyze usage of Microsoft 365 resources with enriched dashboard.
Look out for inefficient usage and drive Office 365 adoption.
Look out for inefficient usage and drive Microsoft 365 adoption.
Optimize adoption and generate noticeable returns on investment
Optimize adoption and generate noticeable returns on investment.

Access a rich and informative Usage and Adoption Dashboard

Say you are tasked with the responsibility of identifying inactive Microsoft 365 users in an effort to micro-target training. This entails collecting and organizing usage data, analyzing it and creating dashboards using PowerBI or Excel to present your findings. This usually takes time and effort on your part.

What if there was a solution that auto-updates regularly and doesn’t need to input data in PowerBI or Excel?

AdminDroid’s Usage and Adoption Dashboard does this and more. Get to understand the nitty-gritty aspects of your user behavior and arrive at insights without having to use Excel or PowerBI.

usage and adoption dashboard

With the Usage and Adoption Dashboard, you can

Get crystal clear stats of Office 365 usage data by filtering the data based on various user properties and you can further categorize it as per your requirements.

Analyze the active/inactive users from a specific department, city, job title, state, country, and company across various Microsoft 365 services.

Obtain the overall summary that provides an overview of the users' activity across all Microsoft 365 services such as Azure AD, Exchange Online, Teams, SharePoint, OneDrive, etc.

Create a View of a dashboard by filtering and saving the required data. You don’t need to filter the data everytime you need it. Just click the saved View to review the filtered data.

Get detailed information of every activity by clicking off the widgets.

Analyze the data for a specific time period by configuring the activity time.

Take a look at dashboards which are equipped with an assortment of filters to slice and dice the data based on your requirements.

Powerful Report Collections for In-depth Details

AdminDroid provides various report collections for easy access and navigation between reports single-handedly. For Usage and Adoption, it provides the below report packages to identify resource usage, apps usage, device usage, users' inactivity, etc. Take a look at what the report packages offer you across various Microsoft 365 services.

M365 Usage

Get the resource usage activity of users under various M365 services like Exchange, Teams, OneDrive, SharePoint, Yammer, etc.

M365 Apps Usage

Get the active users' details and various app usage in the Office 365 environment.

Inactive Users

Retrieve the inactive users in all M365 services, last logon time, inactive mailboxes, etc. Also, get the user’s inactivity details based on their activities.

Microsoft 365 Apps Usage

Azure Active Directory

Exchange Online

Microsoft Teams

SharePoint Online

OneDrive for Business

Yammer

Show All