3600+ reports! And still there is room for more stats.
Make reports your own with our Vast Reporting Capabilities

Analyzing a report and suspecting that an event needs to be tracked? Prompt the alerting agent directly from the report; No switching between pages.
Need not constantly check your reports for changes - The tool will alert you when there's something you need to see.
Understand the alert trends with our reports about the triggered alerts. Unusual activity patterns or unexpected changes in configurations – Find out everything!

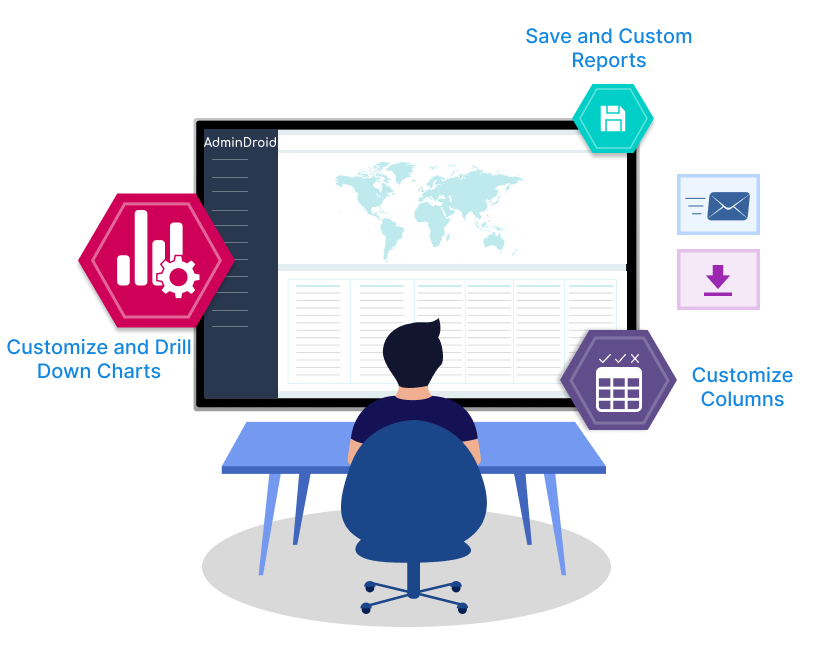
Traditional stats and counts are now interactive geo-location maps, dynamic heatmaps, customizable donuts, informative bars, and detailed pie charts.
Taking interactivity seriously, we present charts that are live. Filter the report however you like, and see the charts re-rendered based on filtered results.
Each bar in a chart means a lot. You can drill down every chart to find out the granular insights beneath them.
As we won’t stop with customizable charts, we give you all the tools to create your own charts. Leave no data unvisualized.
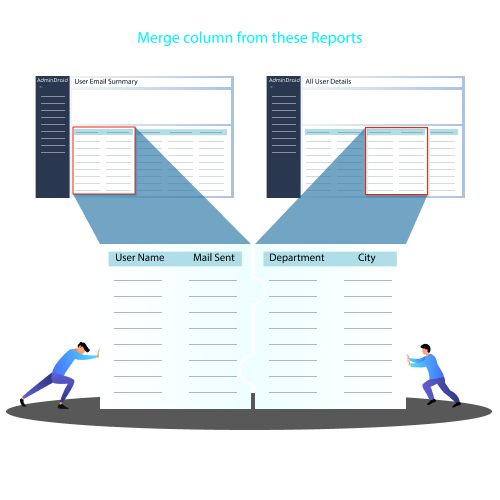
Don't settle for incomplete reports. Bring in columns from other reports to create a fully personalized view of your data.
Don’t wonder how we computed the stats. Just click the counts to find out what we mean.
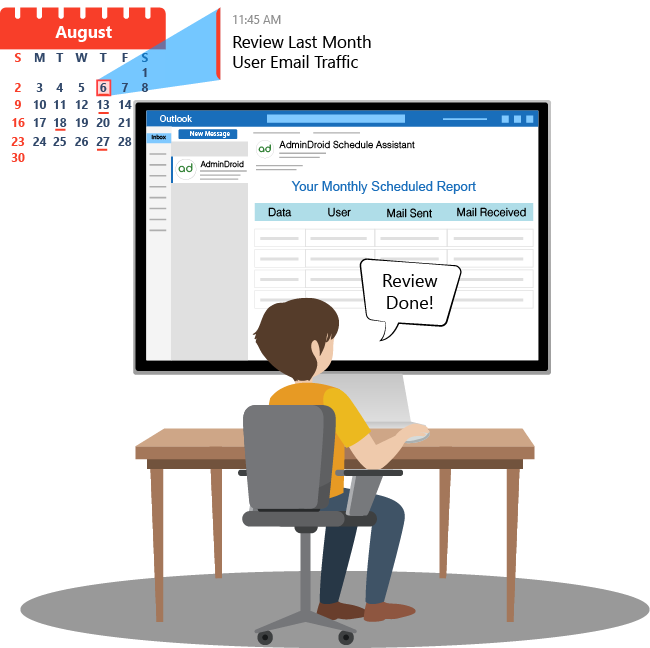
Tired of preparing weekly reports? Instruct the scheduler once, see every report sent on time! No errors; no forgetfulness;
A sneak peek of report in email: Skip the hassle of downloading attachments, just skim the email for data-driven decisions!
Got a perfect view of a report with all your customizations? Straightway schedule the customized view directly from the report.
Let our scheduler know if the data is being reviewed monthly, and the scheduler will email only the last month’s data.

Export customized reports in various formats or share them via email. Use them in the way you want.
Not just email them the reports, also include a curated preview in the email. We are sure they’ll be impressed.
PDF, CSV, HTML, XLS, XLSX and even computer-friendly RAW format to integrate with other tools.

Clear about your requirement? No problem then. Our Intelligent Search gives you the required reports from just a few keywords.
Our bundles of reports for each requirement are the easiest way to approach complex requirements that demands tracking multiple trends and metrics.
Every report is equipped with curated ‘Easy Filters’ that are frequently used in this report worldwide.
No typing needed to apply filters; Simply select from all the appropriate options that our filters compiled for you.
Don’t hesitate to zoom in on a record! One click on our ‘Quick Filters’, and you can swiftly narrow down report based on a particular data you noticed in the report.
We know building reports from scratch is an uphill battle. Instead, have our analytically sound reports, customize them, and make them all yours.
Customize once, use forever. All the customizations you make can be saved as your ‘View’ and even made available for other executives to use.
We give you the ability to add or remove columns from any report, rearrange them, resize them, and even sort the data based on multiple columns.
3600+ reports! And still there is room for more stats.
Make reports your own with our Vast Reporting Capabilities