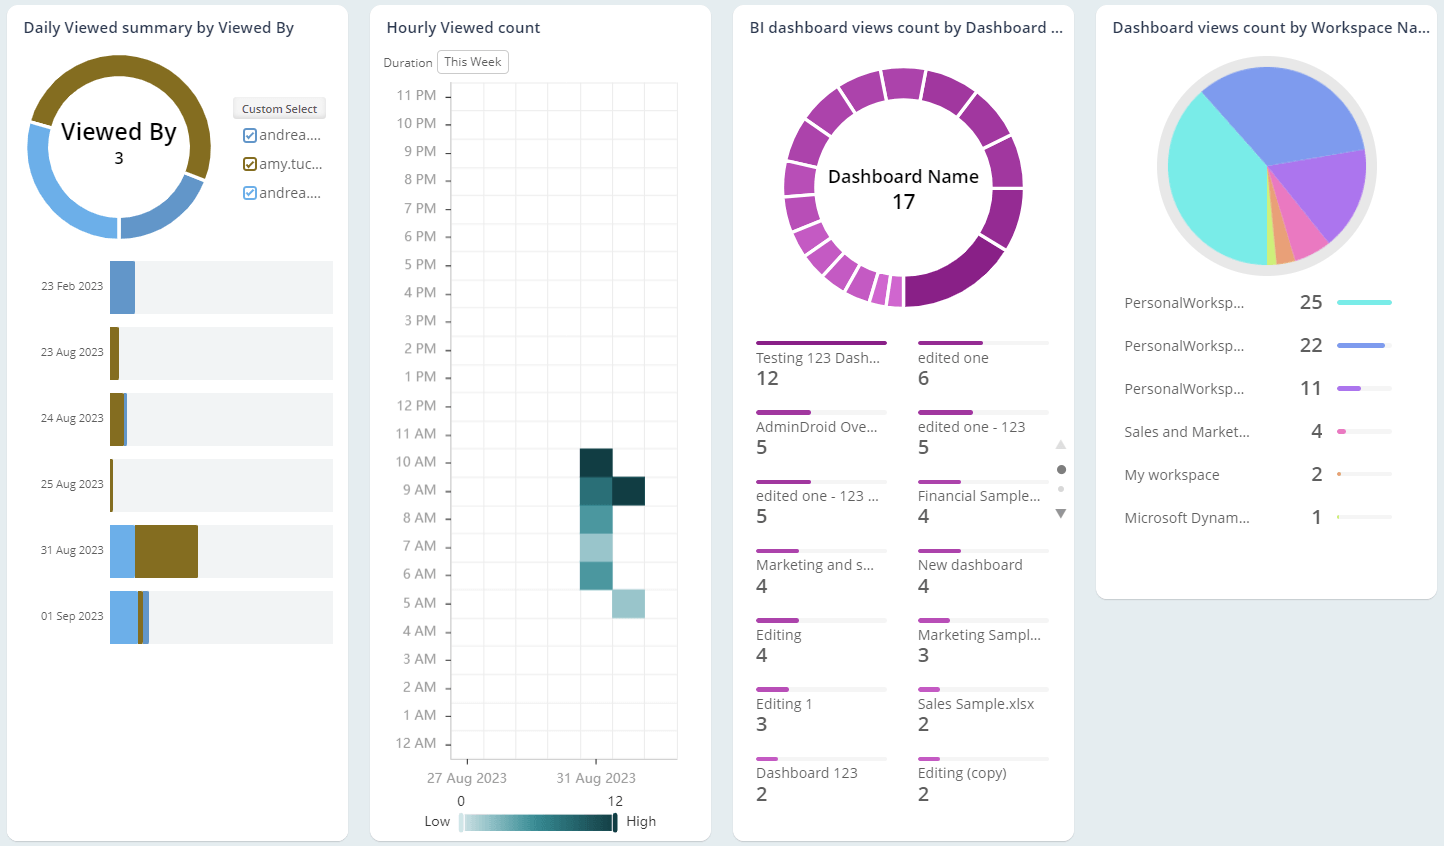
Microsoft Power BI Dashboard Activity Audit Reports
Microsoft Power BI dashboard is a powerful feature that provides a consolidated view of key metrics, data, and reports, enabling users to visualize business data in an appealing manner. Monitoring Power BI dashboard activities is crucial as it will help admins to deliver dashboards with accurate information. However, the native auditing method presents a challenge for administrators when tracking exclusive Power BI dashboard audit activities. Here, AdminDroid comes into play, offering a solution that simplifies & streamlines Power BI activity tracking process for admins.
AdminDroid provides an easy way to export the reports to
CSV
Excel
HTML
Raw
Don't wait for cyberattacks - prevent them with proactive AdminDroid alerts.
Intelligently compares past trend of events and picks out oddities.
More than 1400 alertable events audited regularly.
Admin specific alerts curated to defend org-level breaches.
Set thresholds to detect strange spikes in exploitable activities.
Not just alert mails – drill down data to find what went wrong.
Granular Delegation – Completely control who can see what in AdminDroid.
Delegate Executive Summary dashboards to CEO.
Empower Managers with their Team-specific stats.
Customized AdminDroid portal for each department.
Don’t make your License Admin wait for the reports – Just Delegate!
Nothing less, nothing more – ‘Preview’ to ensure perfect delegation.
The reports are not just tables! Every report ramped up with AI-powered graphs.
Locate user activities from unusual locations.
Visualize user inactivity trends with heat maps.
Let AI bring your data to life with dynamic donuts, Pies, and Bars.
Drill down the charts and make sense of complex data.
What you see in dashboards – just stats and counts; what we process beneath - millions of records!
Dashboard counts are not just numbers – drill down details behind, right on dashboard.
We connected the dots between reports – Result: unimaginable holistic picture.
Customizing reports is now a piece of cake when you have the below features.
Merge columns from different reports to get your perfect report.
Infinite number of filters available to slice and dice a report.
You can export, email and schedule the customized reports to be emailed automatically.
Are important columns jumbled in different O365 admin center reports?
No more missing pieces with AdminDroid’s mergeable columns.
No column left behind - filter columns that are not even available in report.
Schedule reports once and let AdminDroid do the rest.
Save time and effort by automating O365 reports distribution.
Don't waste time opening attachments - Get quick overview with email previews.
Avoid cluttered inbox with empty report blocking.
Bypass attachment size limits with downloadable links.
Say goodbye to finding PowerShell scripts forever with Admindroid's handy ReportBoards.
No more locating reports! Just name your use-case, we’ll show you the reports!
Export or email all the reports for your use-case in one go.
Never miss a beat with AdminDroid's seamless data syncing from Office 365.
Effortlessly stay up-to-date with AdminDroid's regularly synced data.
Manual sync triggers available to give you the total control.
Track sync progress to ensure that you stay ahead of the game with fresh data.
Stay in the loop with AdminDroid's Activity Tracker.
Monitor user activities in AdminDroid to stay compliant.
Ultimate detective to trace back critical user events in AdminDroid.
